How to use APP with siMPle
1. Load or convert the files
.spe, or .dmd, .dx, etc.
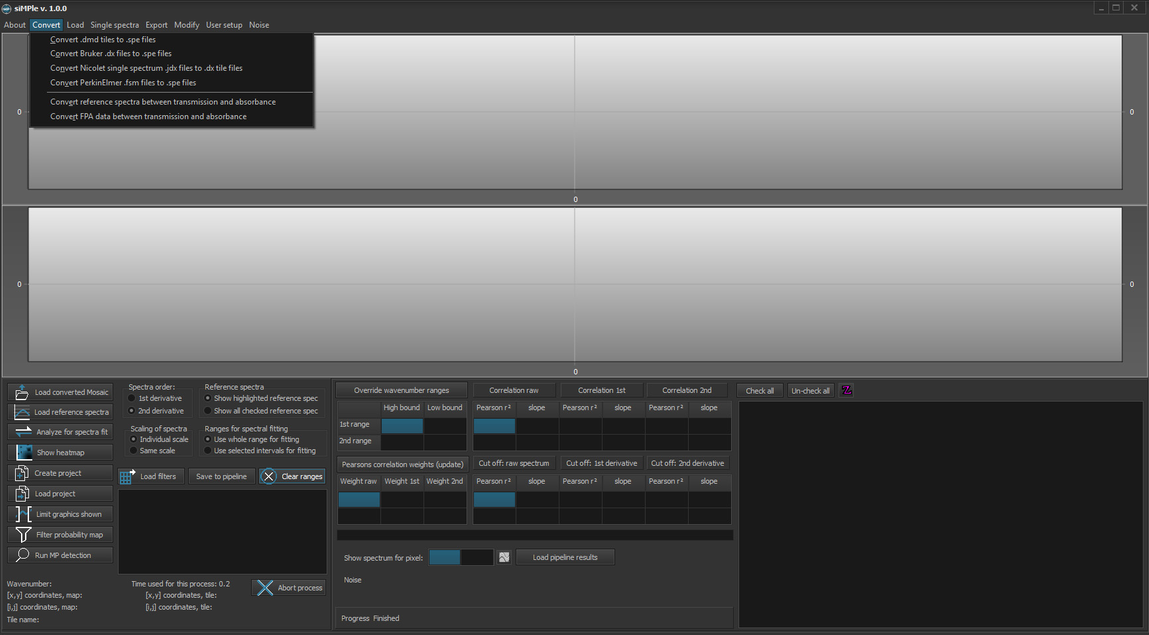
2. Load the reference file
For AWI analysis: siMPle_automated_analysis_library_VersionX.txt
It is available on the Downloads page
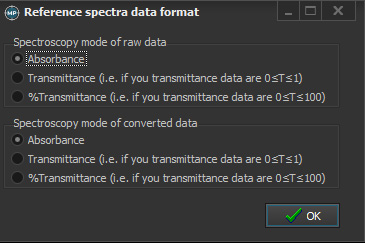
Please keep in mind that the reference data was measured in absorbance and press OK
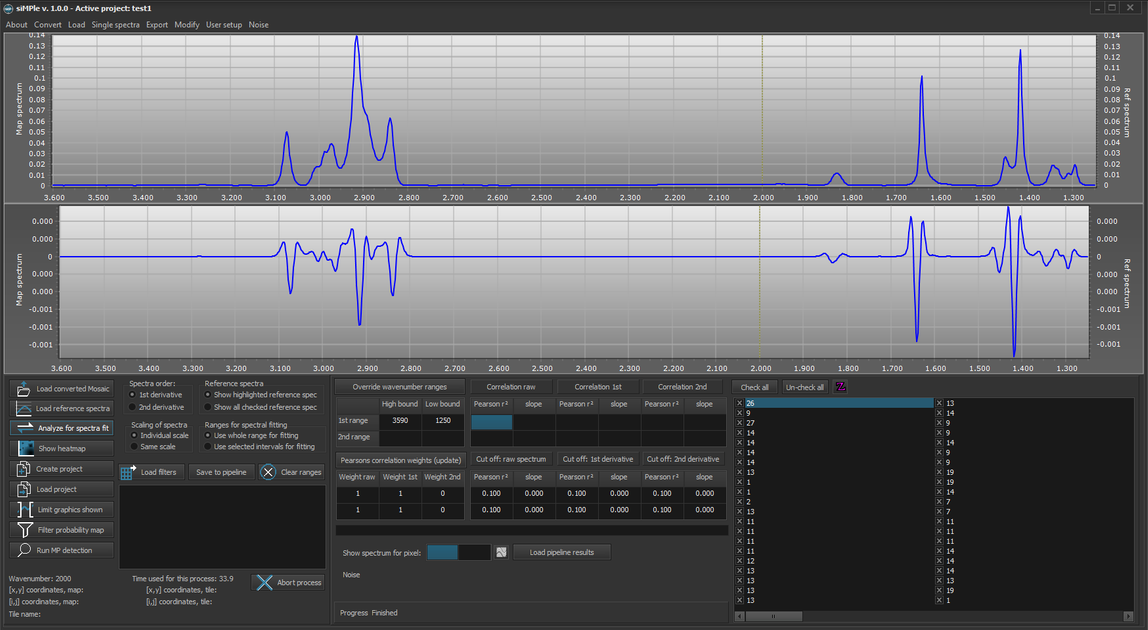
3. It should now look like this:

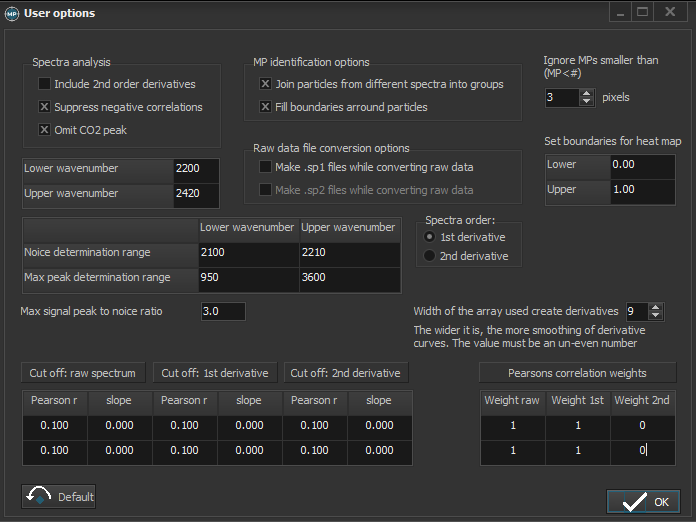
4. Please check user setup -> options
And adjust to these values and options:
5. Start the calculation
via pressing "Analyze for spectra fit"
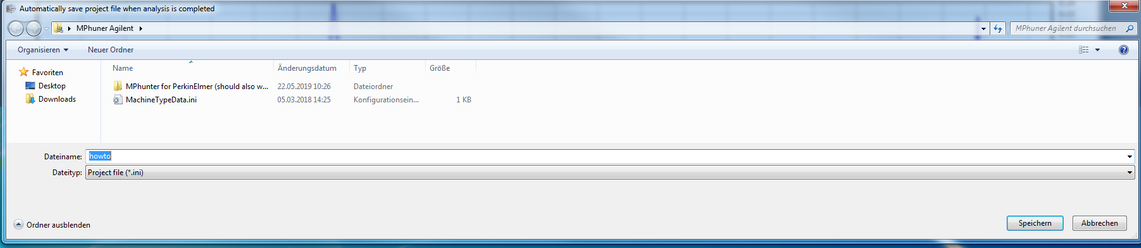
Proceed by clicking OK
And generate a project file, here "How to" and click save.
6. Wait until the calculations are finished
7. Afterwards, click on the button "Save to pipeline"
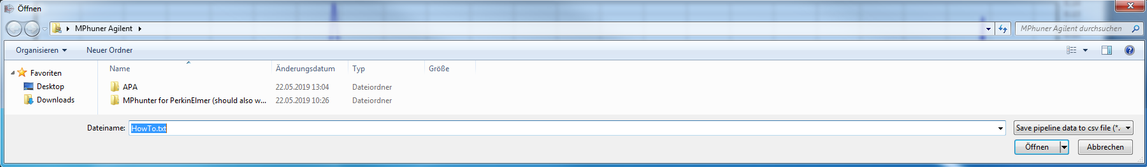
8. Chose a file name
Take care not to rename the database file (currently it is the default name generated by siMPle):
Saving the file may take a while.
9. Open the APA.exe or MPAPP.exe
(Both filenames contain also the current version number as eg. APAv1.01.exe, which may differ due to updates) depending on the pipeline you want to use.
The files are available here
10. After a short while the user interface shows up:
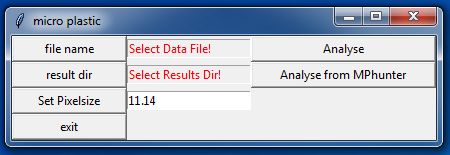
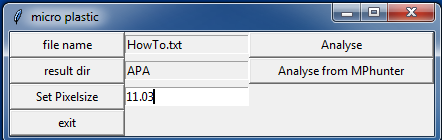
11. Please set the pixelsize
to the value of your system, here 11.03, and press Set Pixelsize (otherwise 11.14 will be used as default).
12. By pressing “file name” you can chose the generated file
Here HowTo.txt in the “MPhunter Agilent” folder
13. Choose a result folder by pressing “result dir”
Here APA in the “MPhunter Agilent” folder.
This folder needs to be in the same folder as the executable and currently no subfolders are allowed (known bug, work in progress).
After all folders, files and settings are set
14. Please press Analyse from MPhunter
to start the analysis of the generated data followed by Image Analysis.
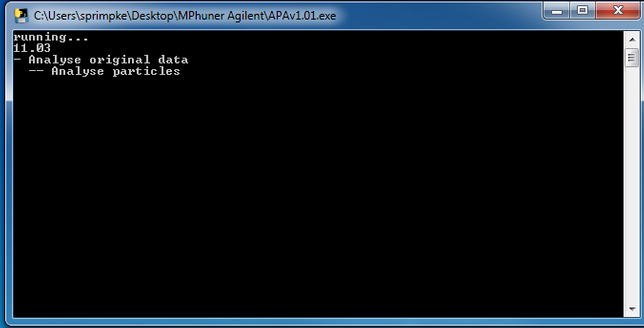
The start should look like this:
15. Finished analysis:
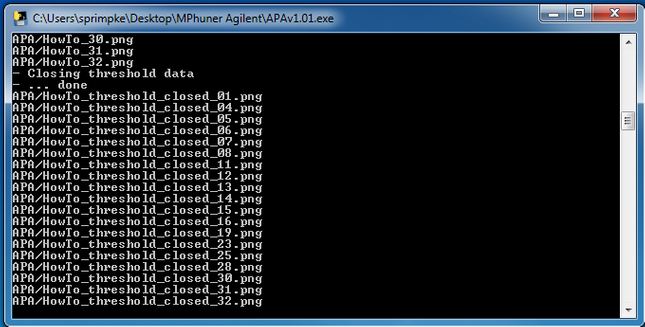
15. The generated data contains various different files including all data and images generated during image analysis:
a.) A histogram for polymer type hits based on spectra.
b.) The combined (_closed_image.csv) and the individual (_closed_imageID.csv, ID = 01, etc.) image files.
c.) The number of particles found for each pixel area (_particle_histogramID.csb)
d.) All individual particle information (which number has which size) as _individualID.csv.
e.) A histogram for polymer type hits based on particle (_particles_perpolymer.csv)
f.) The size classes used in various publication:
_sizeclassesID.csv for individual particles types,
_bio for natural materials,
_polymer for plastic materials,
_other for all other materials,
_bulk (bio, polymer and other combined),
_forcalculations (all individual sizeclasses in one file):
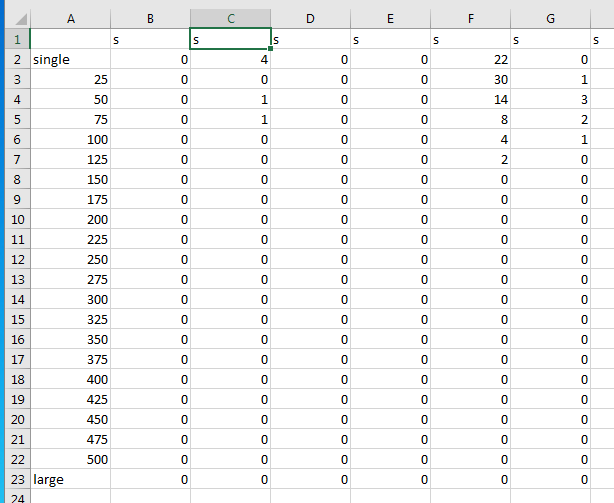
Data reads as followed (the first column label with "s" is not containing data and needs has be skipped for calculations):
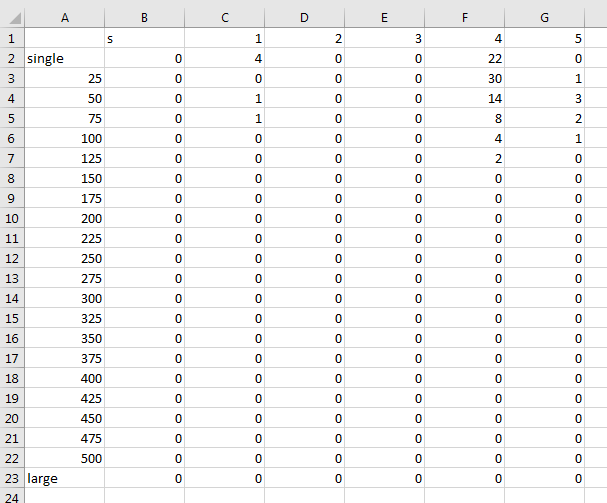
_forstatistics (all individual sizeclasses in one file):)
g.) Greyscale image of the raw and final images.
17. Welcome to the data Jungle! Analysis finished!
18. Troubleshooting:
a.) Error Messages (Traceback):
i.) Missing the threshold.csv file in the folder with the executable for APA/MPAPP:
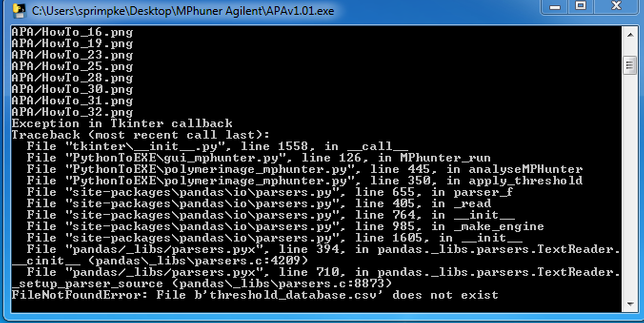
Please copy the provide threshold_database.csv into the folder.
Software for the automated detection of microplastic
Email: info@simple-plastics.eu
© Copyright. All Rights Reserved.